Integrated proteogenomics database

Creating iPtgxDBs

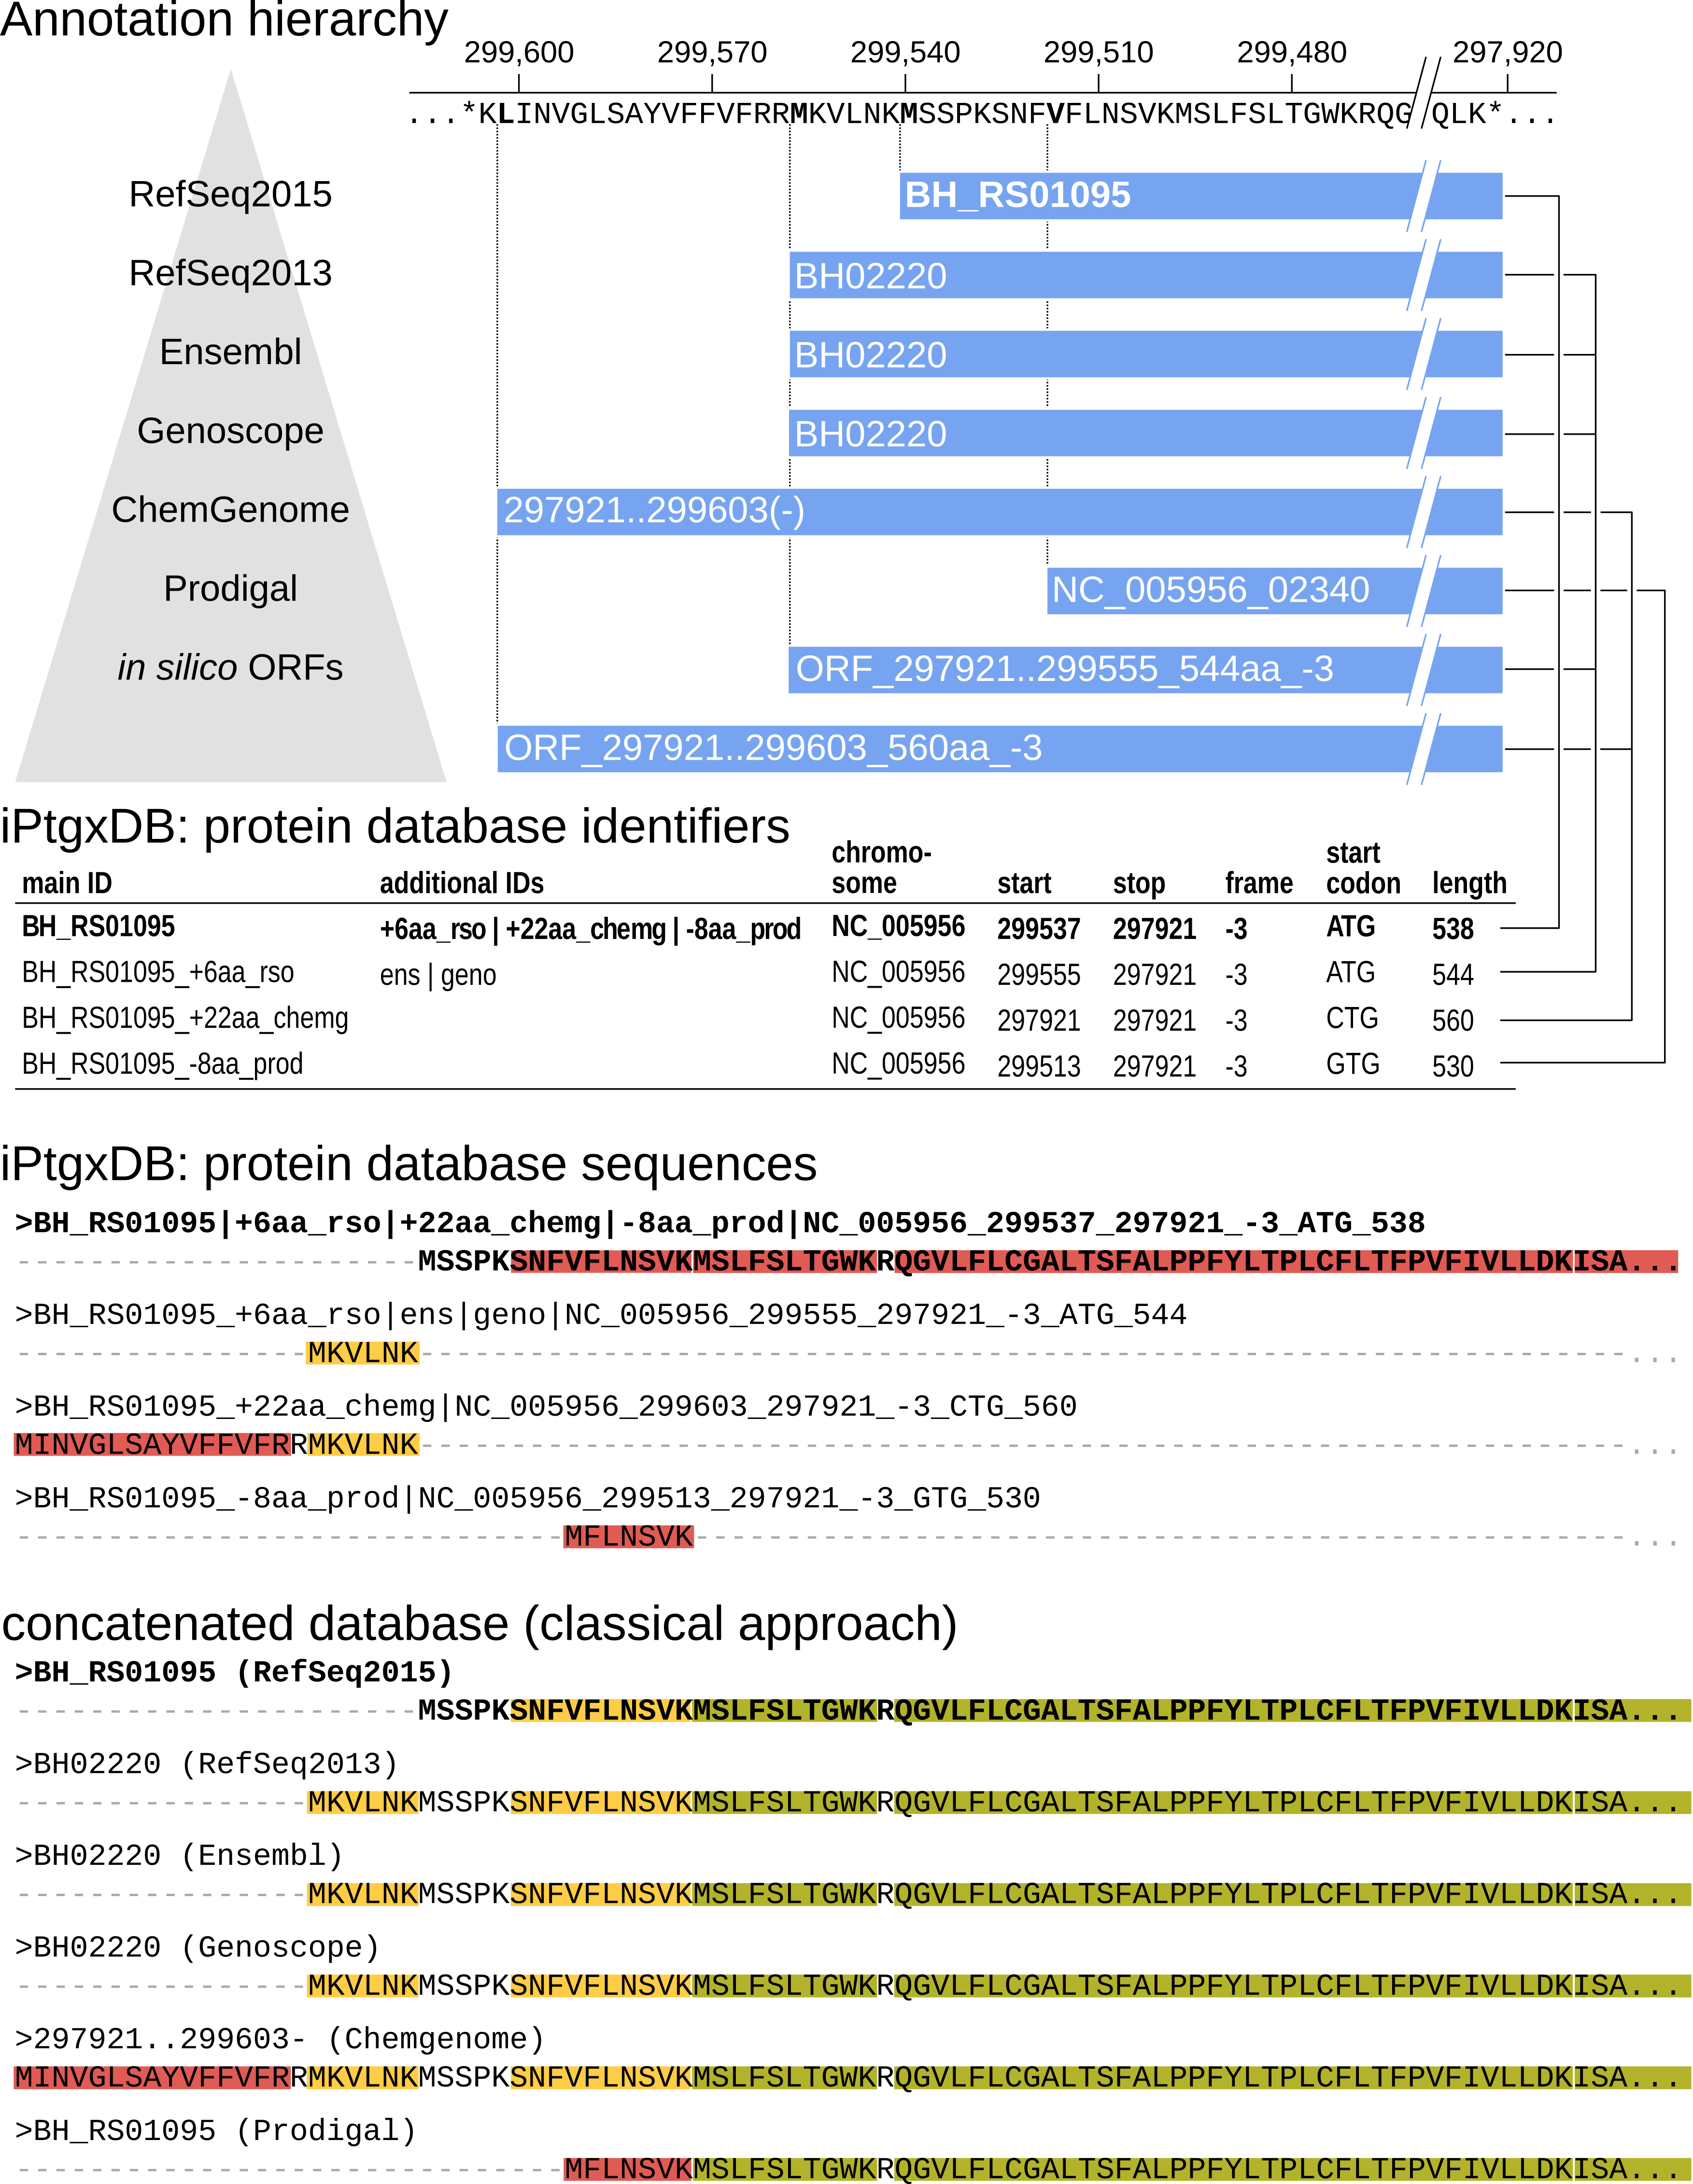
In this example, CDSs and pseudogenes of 7 resources are integrated in a stepwise fashion, following a hierarchy: to leverage the quality of manual curation efforts we start with reference genome annotations, then ab initio predictions, then in silico ORFs from a six-frame translation. A unique aspect of our iPtgxDBs is that almost all peptides uniquely identify one specific protein. This was accomplished by extending the PeptideClassifier concept [1] for prokaryotes [2]. Our extension treats protein sequences with a common stop codon and varying start positions (N-termini) as a protein annotation cluster, i.e. variants of a prokaryotic gene model (similar to isoforms of a eukaryotic gene model). The anchor sequence for an annotation cluster is selected from the annotation highest up in the hierarchy, i.e. here RefSeq2015, unless no CDS is predicted in a given genomic region.

Informative protein identifiers are created (Interpreting identifiers), illustrated for the annotation cluster with the RefSeq2015 anchor sequence BH_RS01095 shown in bold, where three additional start sites exist. The four different proteoforms are added to the protein search DB: the anchor sequence (bold) with the full protein sequence, the extensions (RefSeq2013 and ChemGenome) add the upstream sequence up to the first tryptic cleavage site within the anchor sequence. The shorter Prodigal prediction uses an alternative start codon resulting in a distinguishable N-terminal peptide, and therefore gets also added. The two in silico ORFs are identical to annotations higher up in the annotation hierarchy. Peptide classes are shown for the N-terminal sequences of the CDS annotation cluster (see also Fig. 3B).

Figure 3A, annotation hierarchy illustration
Figure 3A. Generating an iPtgxDB with informative identifiers and a minimally redundant protein search DB in FASTA format.
Figure 3B, bar chart
Figure 3B. Bar chart showing the DB complexity and the peptide classes for RefSeq2015, all 6 integrated annotations without and with in silico ORFs, and the final iPtgxDB. The legend shows colors for the six peptide classes.
Class 1a peptides are most informative as they are unique to one entry in a DB, while class 1b peptides map uniquely to one annotation cluster with all identical sequences. Class 2a peptides identify a subset of sequences from an annotation cluster and class 2b peptides map to all sequences of an annotation cluster. Class 3a peptides map to identical sequences from different annotation clusters (typically duplicated genes). Class 3b peptides map to different sequences from different annotation clusters and are least informative [1].
Figure 3C, boxplots of proteins
Figure 3C. Boxplots of protein length for RefSeq2015 and of those proteins that get added in each successive step to the protein search DB illustrate that we include many sORFs potentially missed in the reference annotations. The length threshold for the in silico ORFs can be selected.

References

  • [1]
    E. Qeli, and C. H. Ahrens. 2010. PeptideClassifier for protein inference and targeted quantitative proteomics. Nature Biotechnology 28: 647-650. 10.1038/nbt0710-647.
  • [2]
    U. Omasits, A. R. Varadarajan, M. Schmid, S. Goetze, D. Melidis, M. Bourqui, O. Nikolayeva, M. Quebatte, A. Patrignani, C. Dehio, J. E. Frey, M. D. Robinson, B. Wollscheid, and C. H. Ahrens. 2017. An integrative strategy to identify the entire protein coding potential of prokaryotic genomes by proteogenomics. Genome Research 27: 2083-2095. 10.1101/gr.218255.116.